![]()
Sustainability
- TOP_EN
- Sustainability
- Environmental Protection Activity
- Hosiden Working Result
Hosiden Working Results
Material Flow
Hosiden group is trying hard to reduce the environmental impact caused by business activities,
by understanding the input data of consumption in resources and energies, and the output data of the
CO2 emission and the amount of the final disposal.
Material Flow of Hosiden Corporation Global Group in fiscal 2023

Effect of reducing CO2
Participation in the Japan Electronics and Information Technology Industries Association (JEITA)
Hosiden Group joined the Commitment to a Low-carbon Society Plan (renamed as the Carbon Neutrality Action Plan in the fiscal year 2021) hosted by the Japanese electrical and electronics industry in the fiscal year 2016 and has been actively working towards improving energy efficiency in line with its industry's goals.
[ Industry Goals ]
Based on the fiscal year 2020 baseline, we aim to improve the energy intensity by an average of at least 1% per year through fiscal year 2030.
46% reduction in total CO2 emissions from FY2023 levels by the end of FY2030 (Scope 1 and 2)
Regarding the acquisition of SBT (Science-Based Targets) certification
Hosiden committed to the Science Based Targets (SBT) initiative in March 2025 and obtained certification in August 2025 (with the SBT announcement made in September). This represents a declaration of our intention to pursue decarbonization more ambitiously. Around the time of the March commitment, we also began promoting the development and implementation of a decarbonization plan aimed at achieving SBT-level reduction targets.
【SBT-level CO2 emissions reduction targets 】
Medium-term target :
Scope 1 and 2 GHG emissions 42% by FY2030 from a FY2023 base year.
Scope 3 GHG emissions 25% by FY2030 from a FY2023 base year.
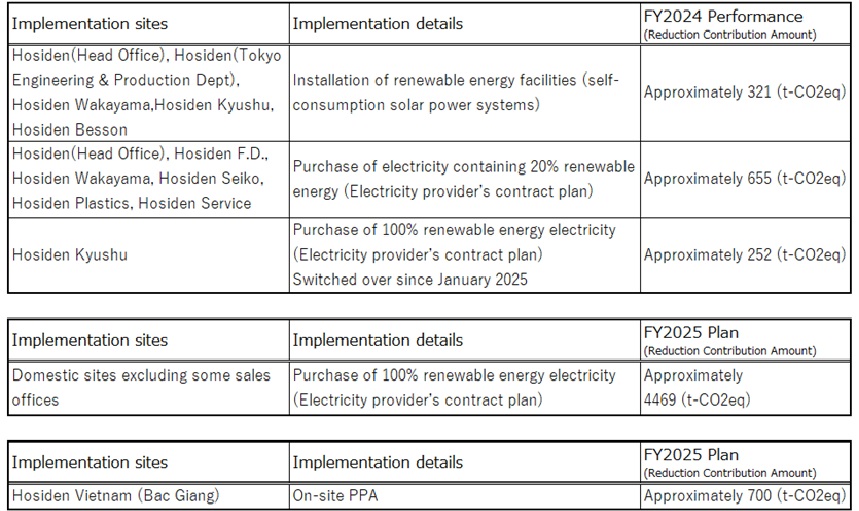
Regarding renewable energy and energy-saving initiatives
As part of our decarbonization efforts, we are implementing renewable energy and energy-saving initiatives across the entire group.
・As part of our renewable energy initiatives, in addition to installing solar power systems at the Head Office and Tokyo Plant, we are conducting surveys on installations at overseas group companies (with the Vietnam factory scheduled to start operations in fiscal year 2026) and considering additional installations. Regarding the switch to renewable electricity, starting in fiscal year 2025, domestic sites (excluding some sales offices) have transitioned to purchasing 100% renewable energy-derived electricity, and we have begun investigating the purchase of renewable electricity at overseas sites. *Please refer to the table below for the status and plans of our renewable energy initiatives.
・As part of our energy-saving initiatives, we select highly energy-efficient equipment when introducing new facilities or replacing existing ones, and we consider fuel switching with decarbonization in mind whenever possible. Additionally, as everyday efforts, we manage air conditioning temperatures appropriately, switch lighting to LED and encourage frequent turn-offs, reduce company-owned vehicles, and promote idling stops, all as part of a united effort that includes raising employee awareness.
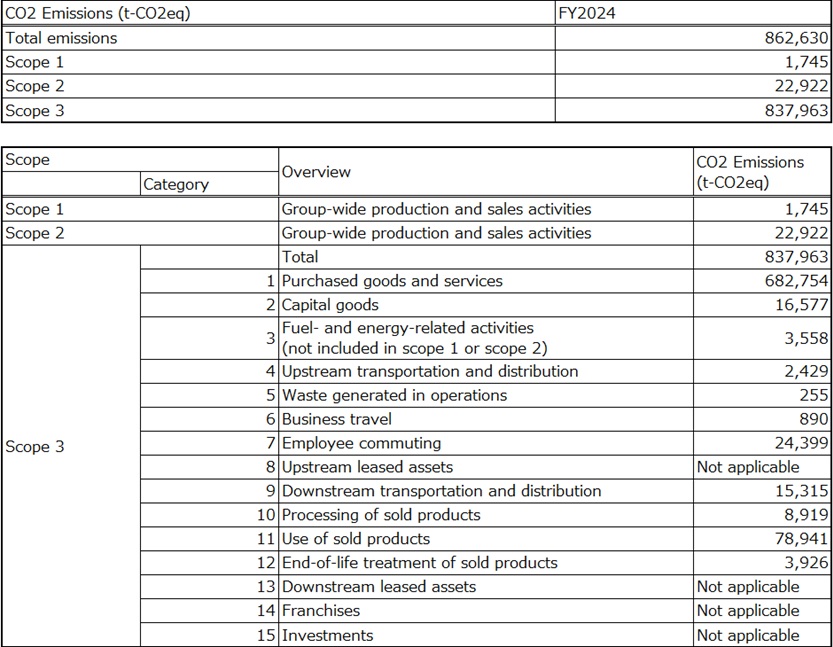
Actual CO2 Emissions and Trends
FY2024 Results
The following table presents the Scope 1, 2, and 3 emissions performance of our global group.
※This data is certified through third-party verification.
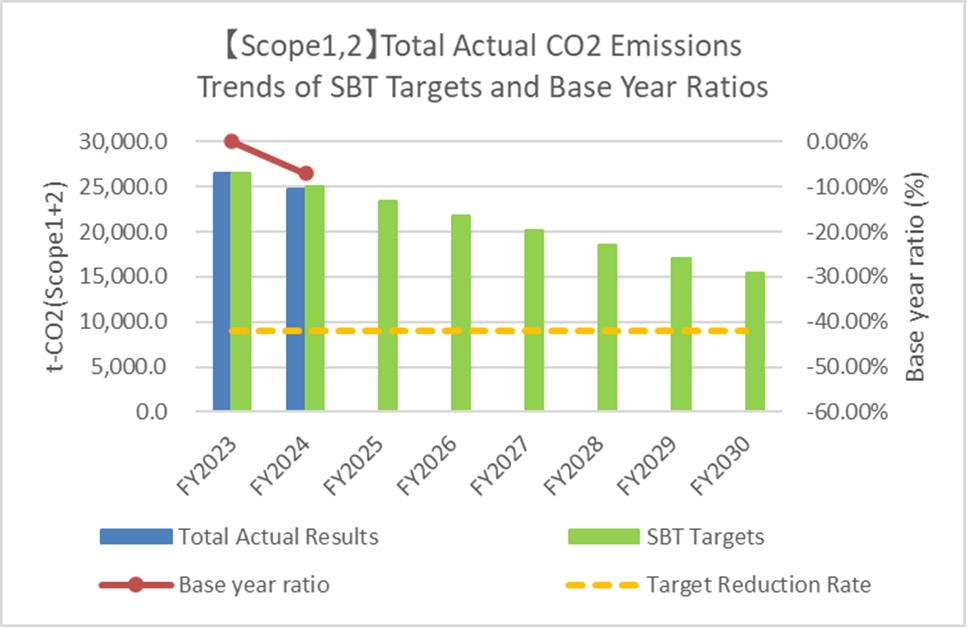
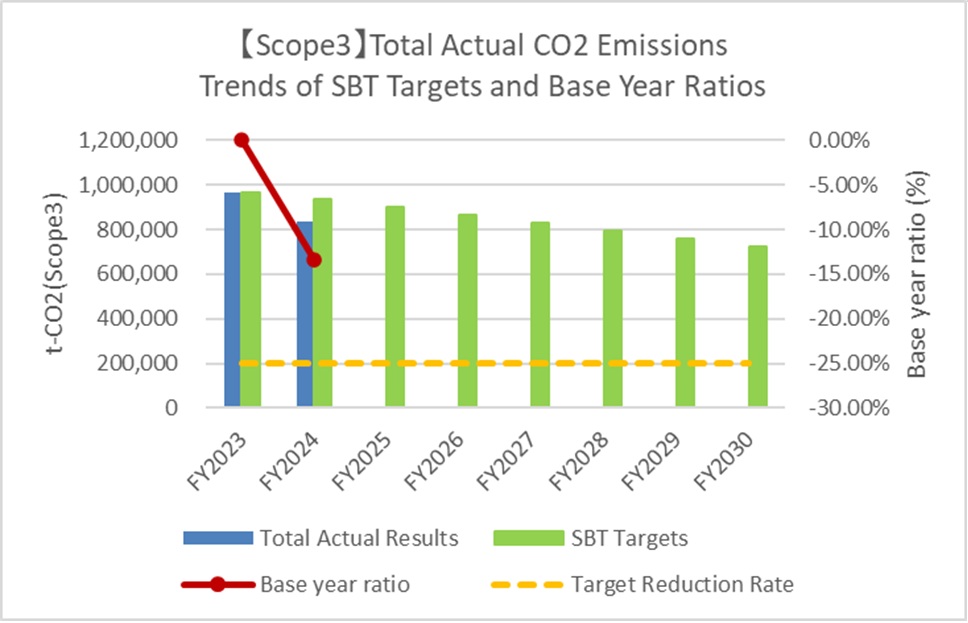
Trends in CO2 Emissions Relative to Reduction Targets
(Scope 1 and 2, Entire Group Emissions)
The following graph illustrates the trends in total CO2 emissions and their changes relative to the base year (FY2013).
※The trends in emissions intensity (per unit of sales) are also shown alongside the other graph.


Trends in Emission Reductions Relative to SBT-Aligned Targets
The graph below shows the progress of actual emissions relative to the SBT-level reduction targets.
※SBT Targets refer to the annual emission targets for each fiscal year, while the reduction rate target indicates the achievement level expected in the target year (FY2030).
(Scope 1+2: 42% reduction compared to the base year, Scope 3: 25% reduction compared to the base year)
Trends in Energy Consumption and Waste Generation of Hosiden Group
■Trends in Energy Consumption ■Trends in Waste Generation
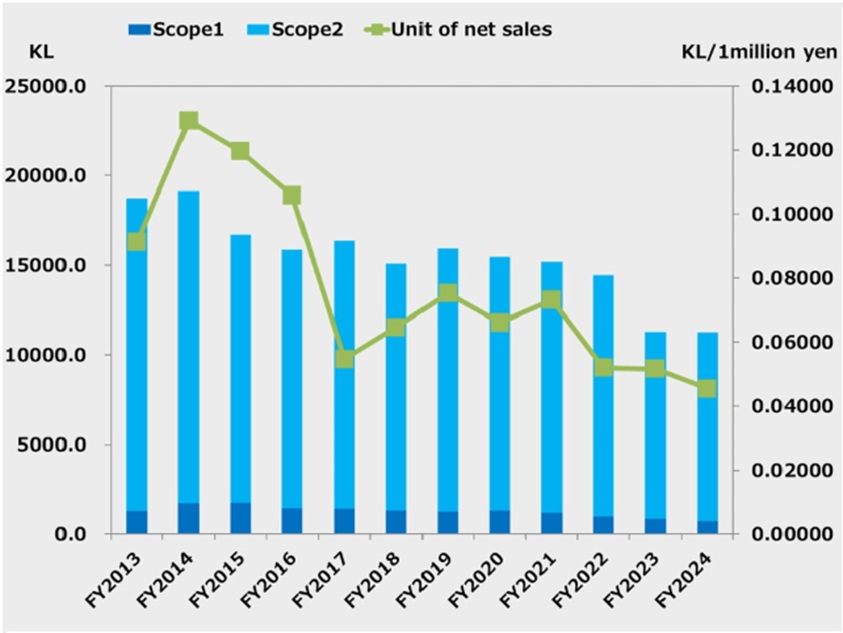 The above graph shows changes in the total energy
consumption of the Hosiden Group,
which is convertedinto crude oil for electricity and fuel consumption.
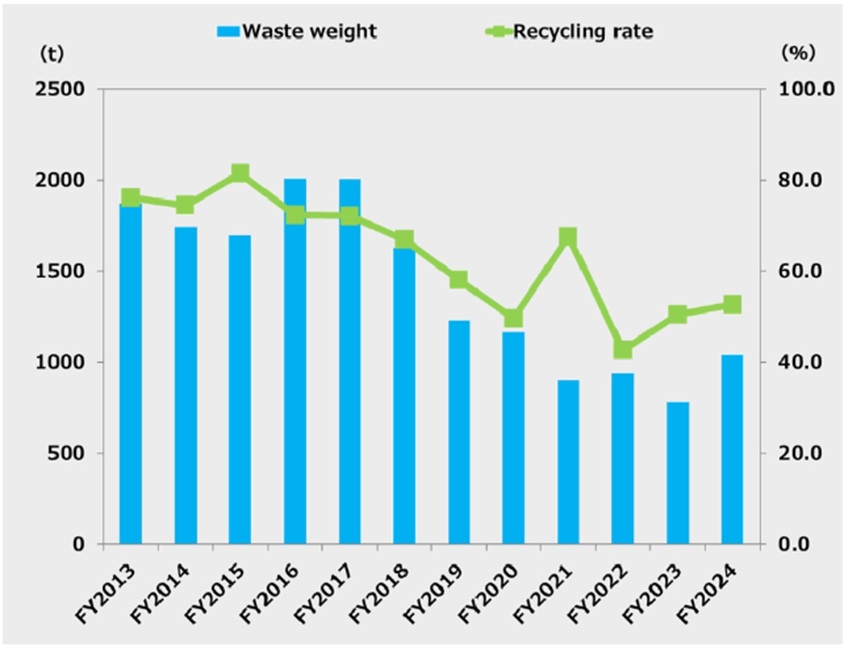 The graph above shouws the transition of the waste of the Hosiden Group.